WorkLink · Owner Dashboard
See which ads bring revenue, not just clicks
Ad spend, enquiries, deals and revenue by source and campaign, plus reply speed by salesperson. Click any number to see the records behind it.
Demo dataWorkLink CRM prototype. Brightway Aircon is a fictional company.
The numbers an owner asks for
Ad platforms report clicks and “conversions”. The Owner Dashboard starts from the people who actually enquired, and follows them to won deals.
Early access. The Owner Dashboard is not generally available yet. The screens on this page come from the WorkLink CRM prototype and show fictional demo data.
-
Spend to revenue
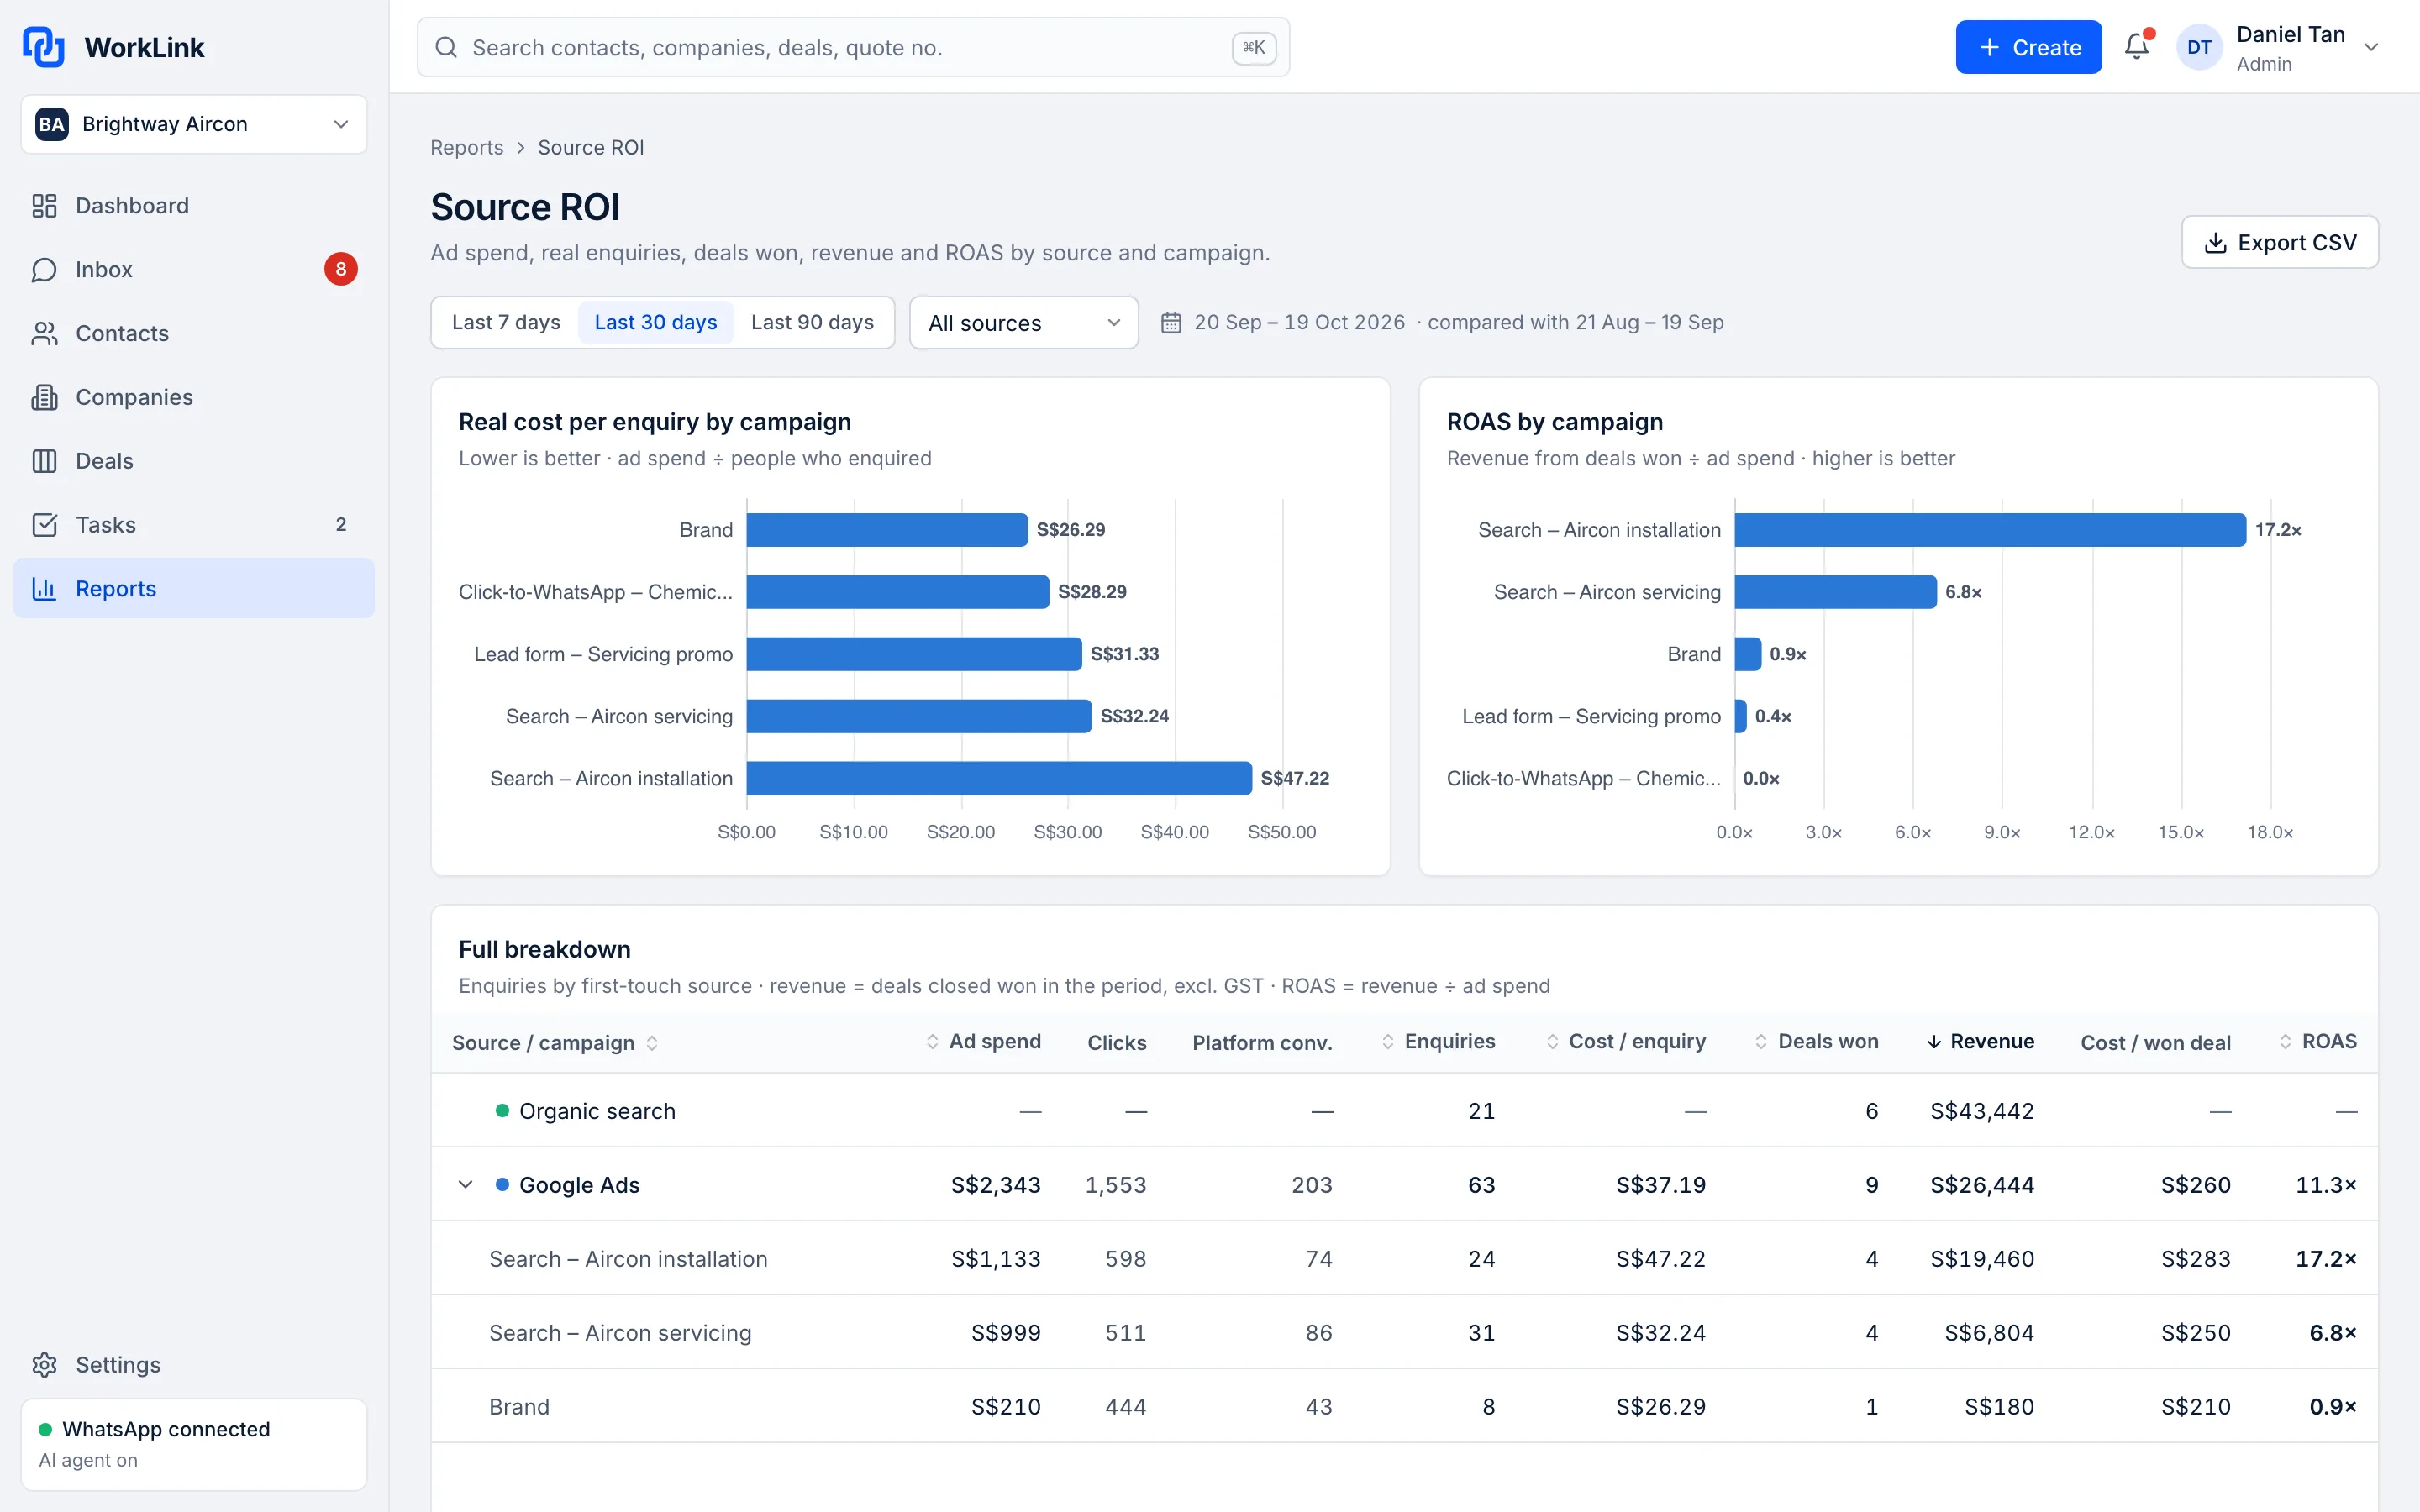
Ad spend to enquiries to deals to revenue, by source and campaign.
-
Every number opens its records
Click through to the people and deals behind it.
-
Reply speed by salesperson
See who keeps customers waiting.
What the Owner Dashboard does
Headline numbers
Five numbers, counted from real people
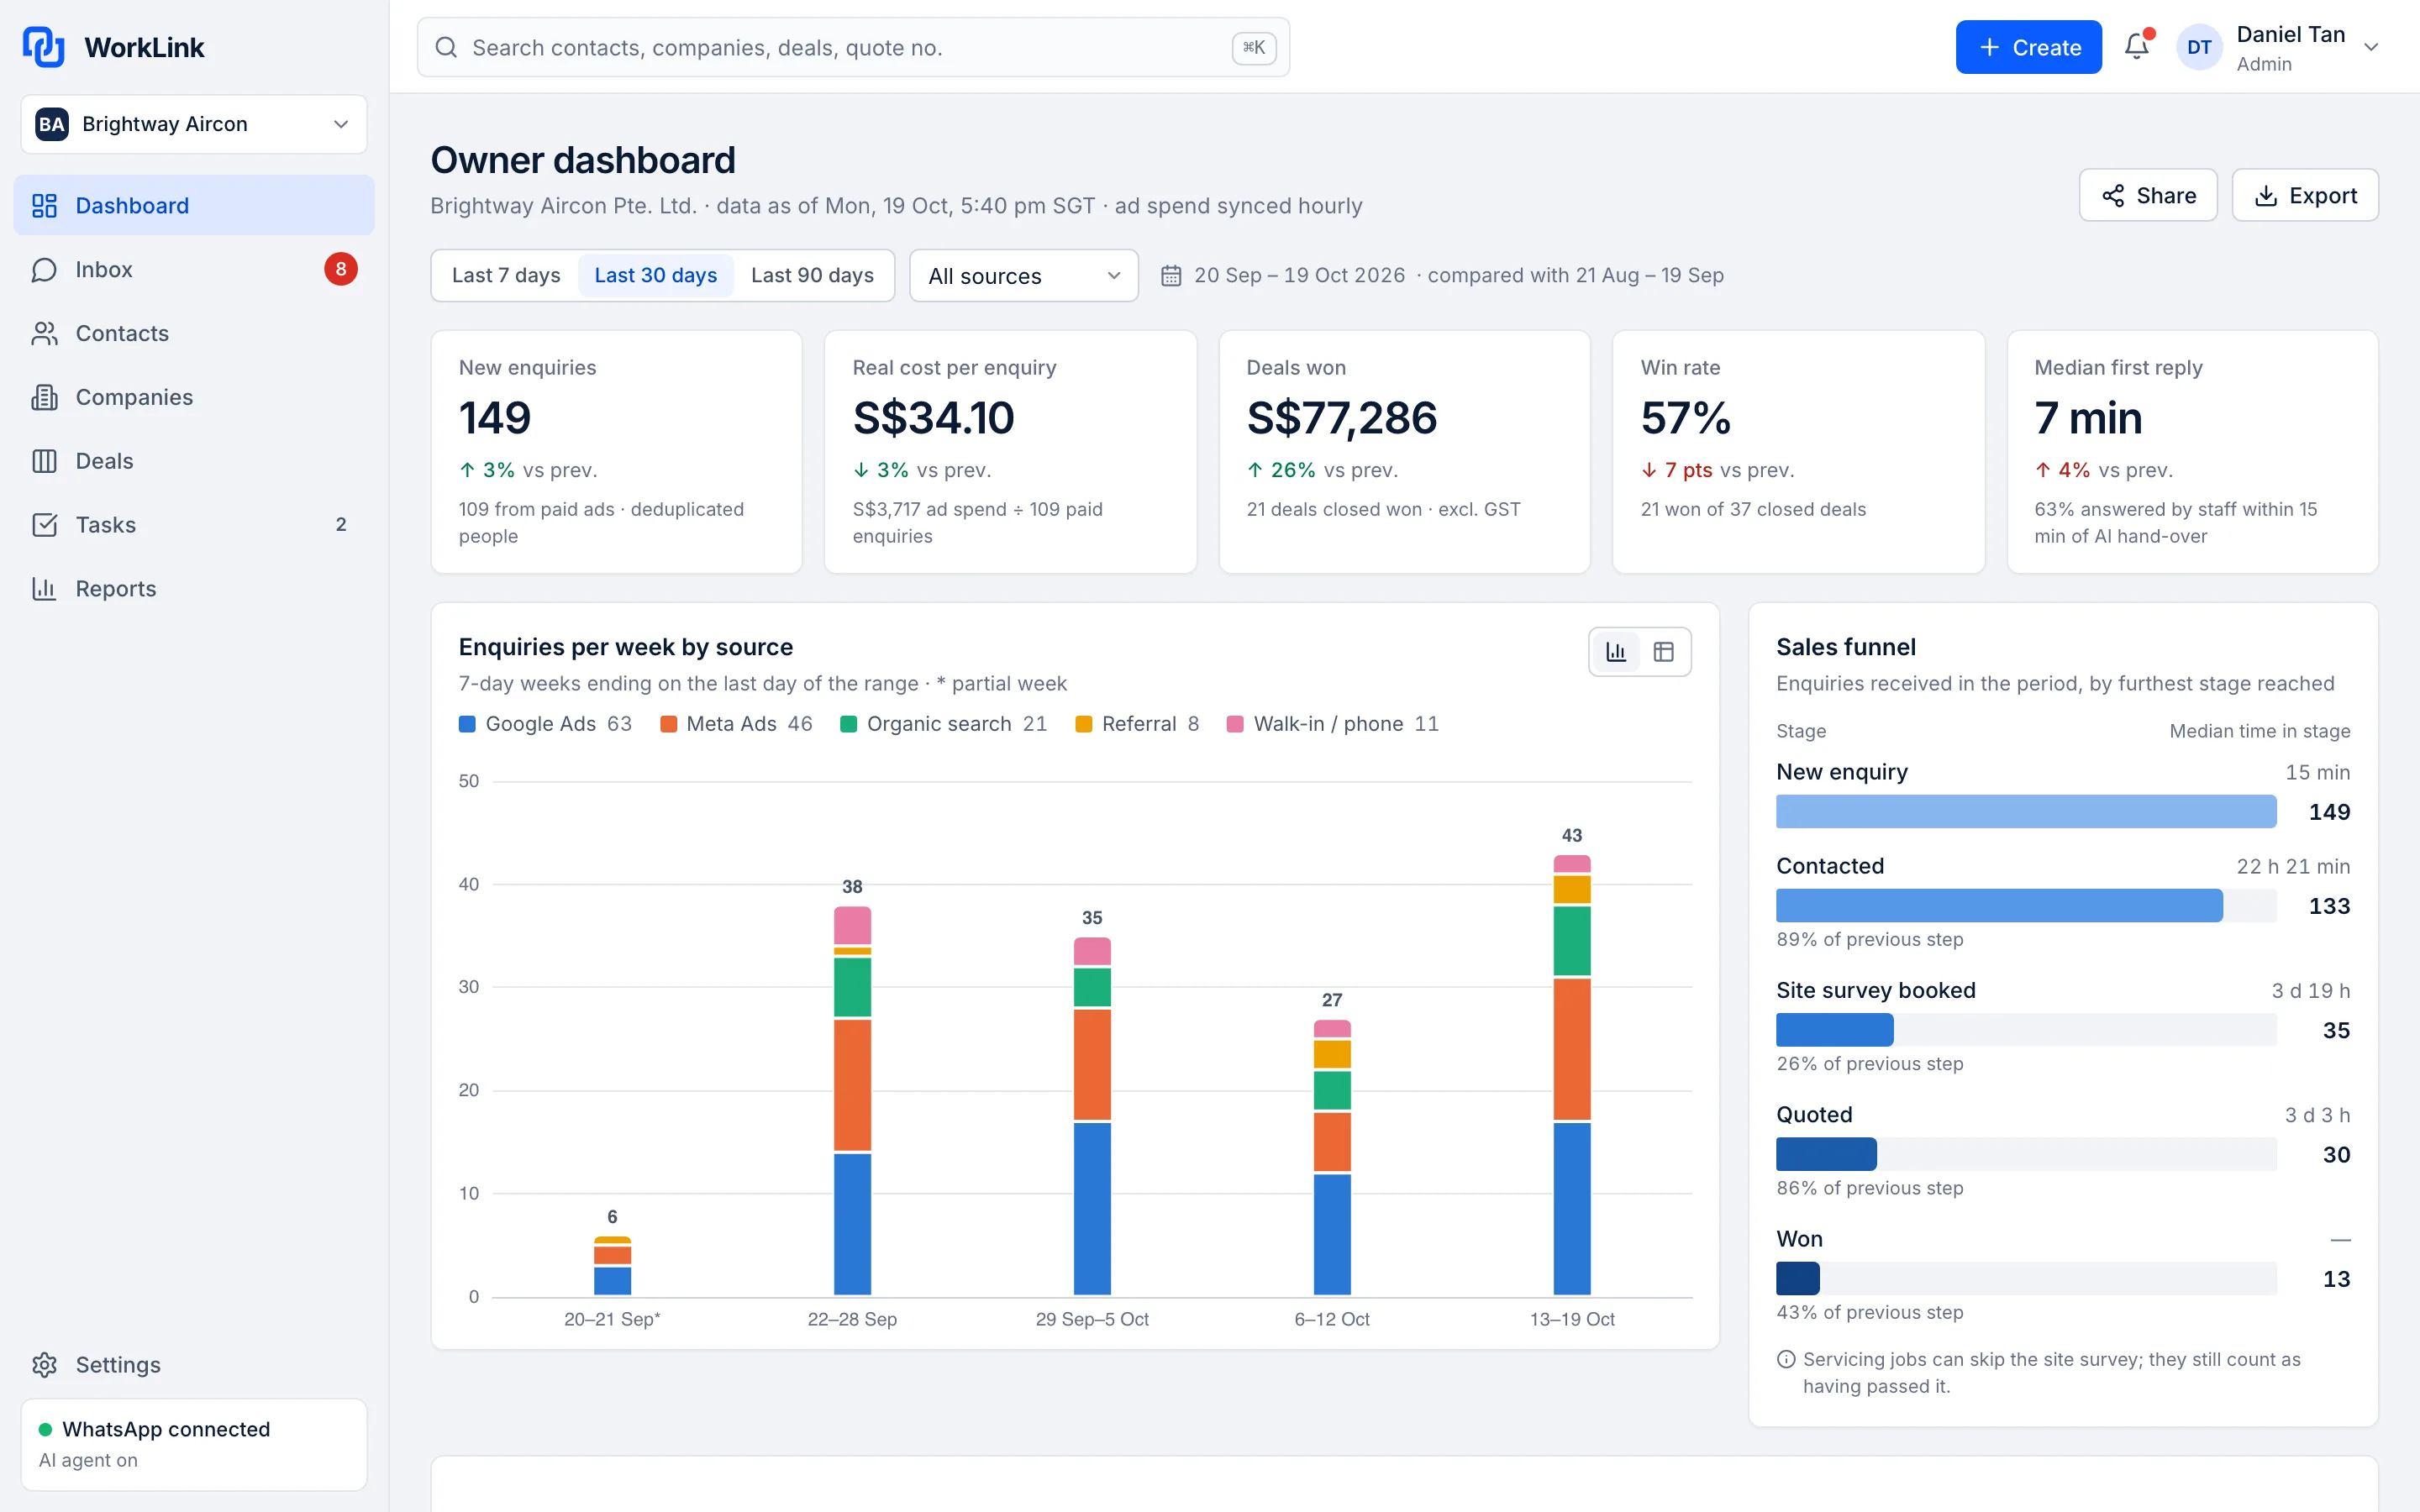
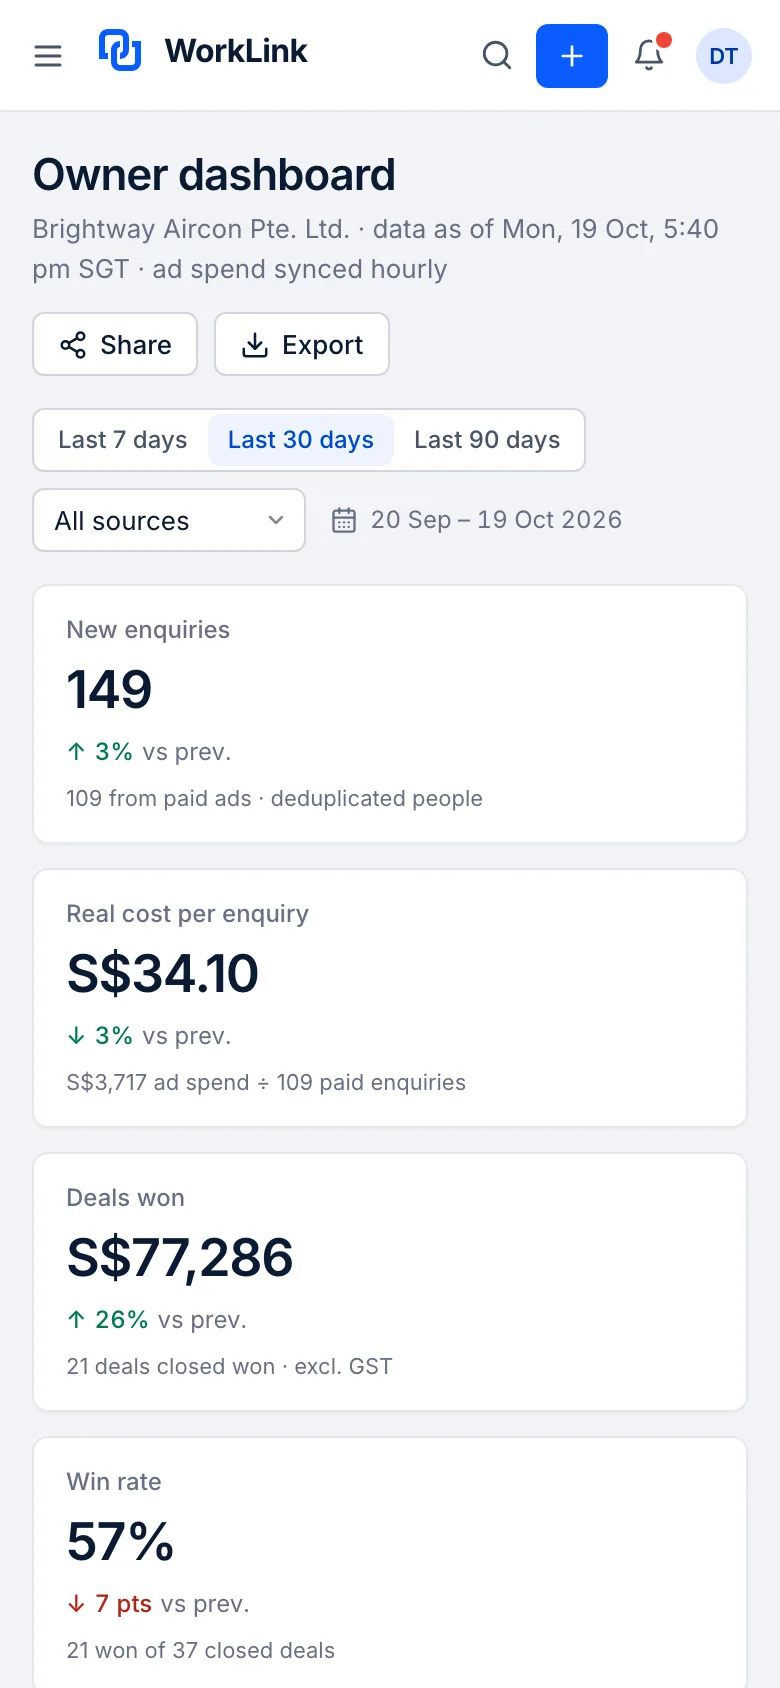
New enquiries, real cost per enquiry, deals won, win rate and median first reply, each compared with the previous period. Real cost per enquiry divides ad spend by paid enquiries, counted as people, not clicks.
- Compared with the previous period
- Filter by date range and source
- Enquiries counted as people, with duplicates removed

Drill-down
Every number opens the records behind it
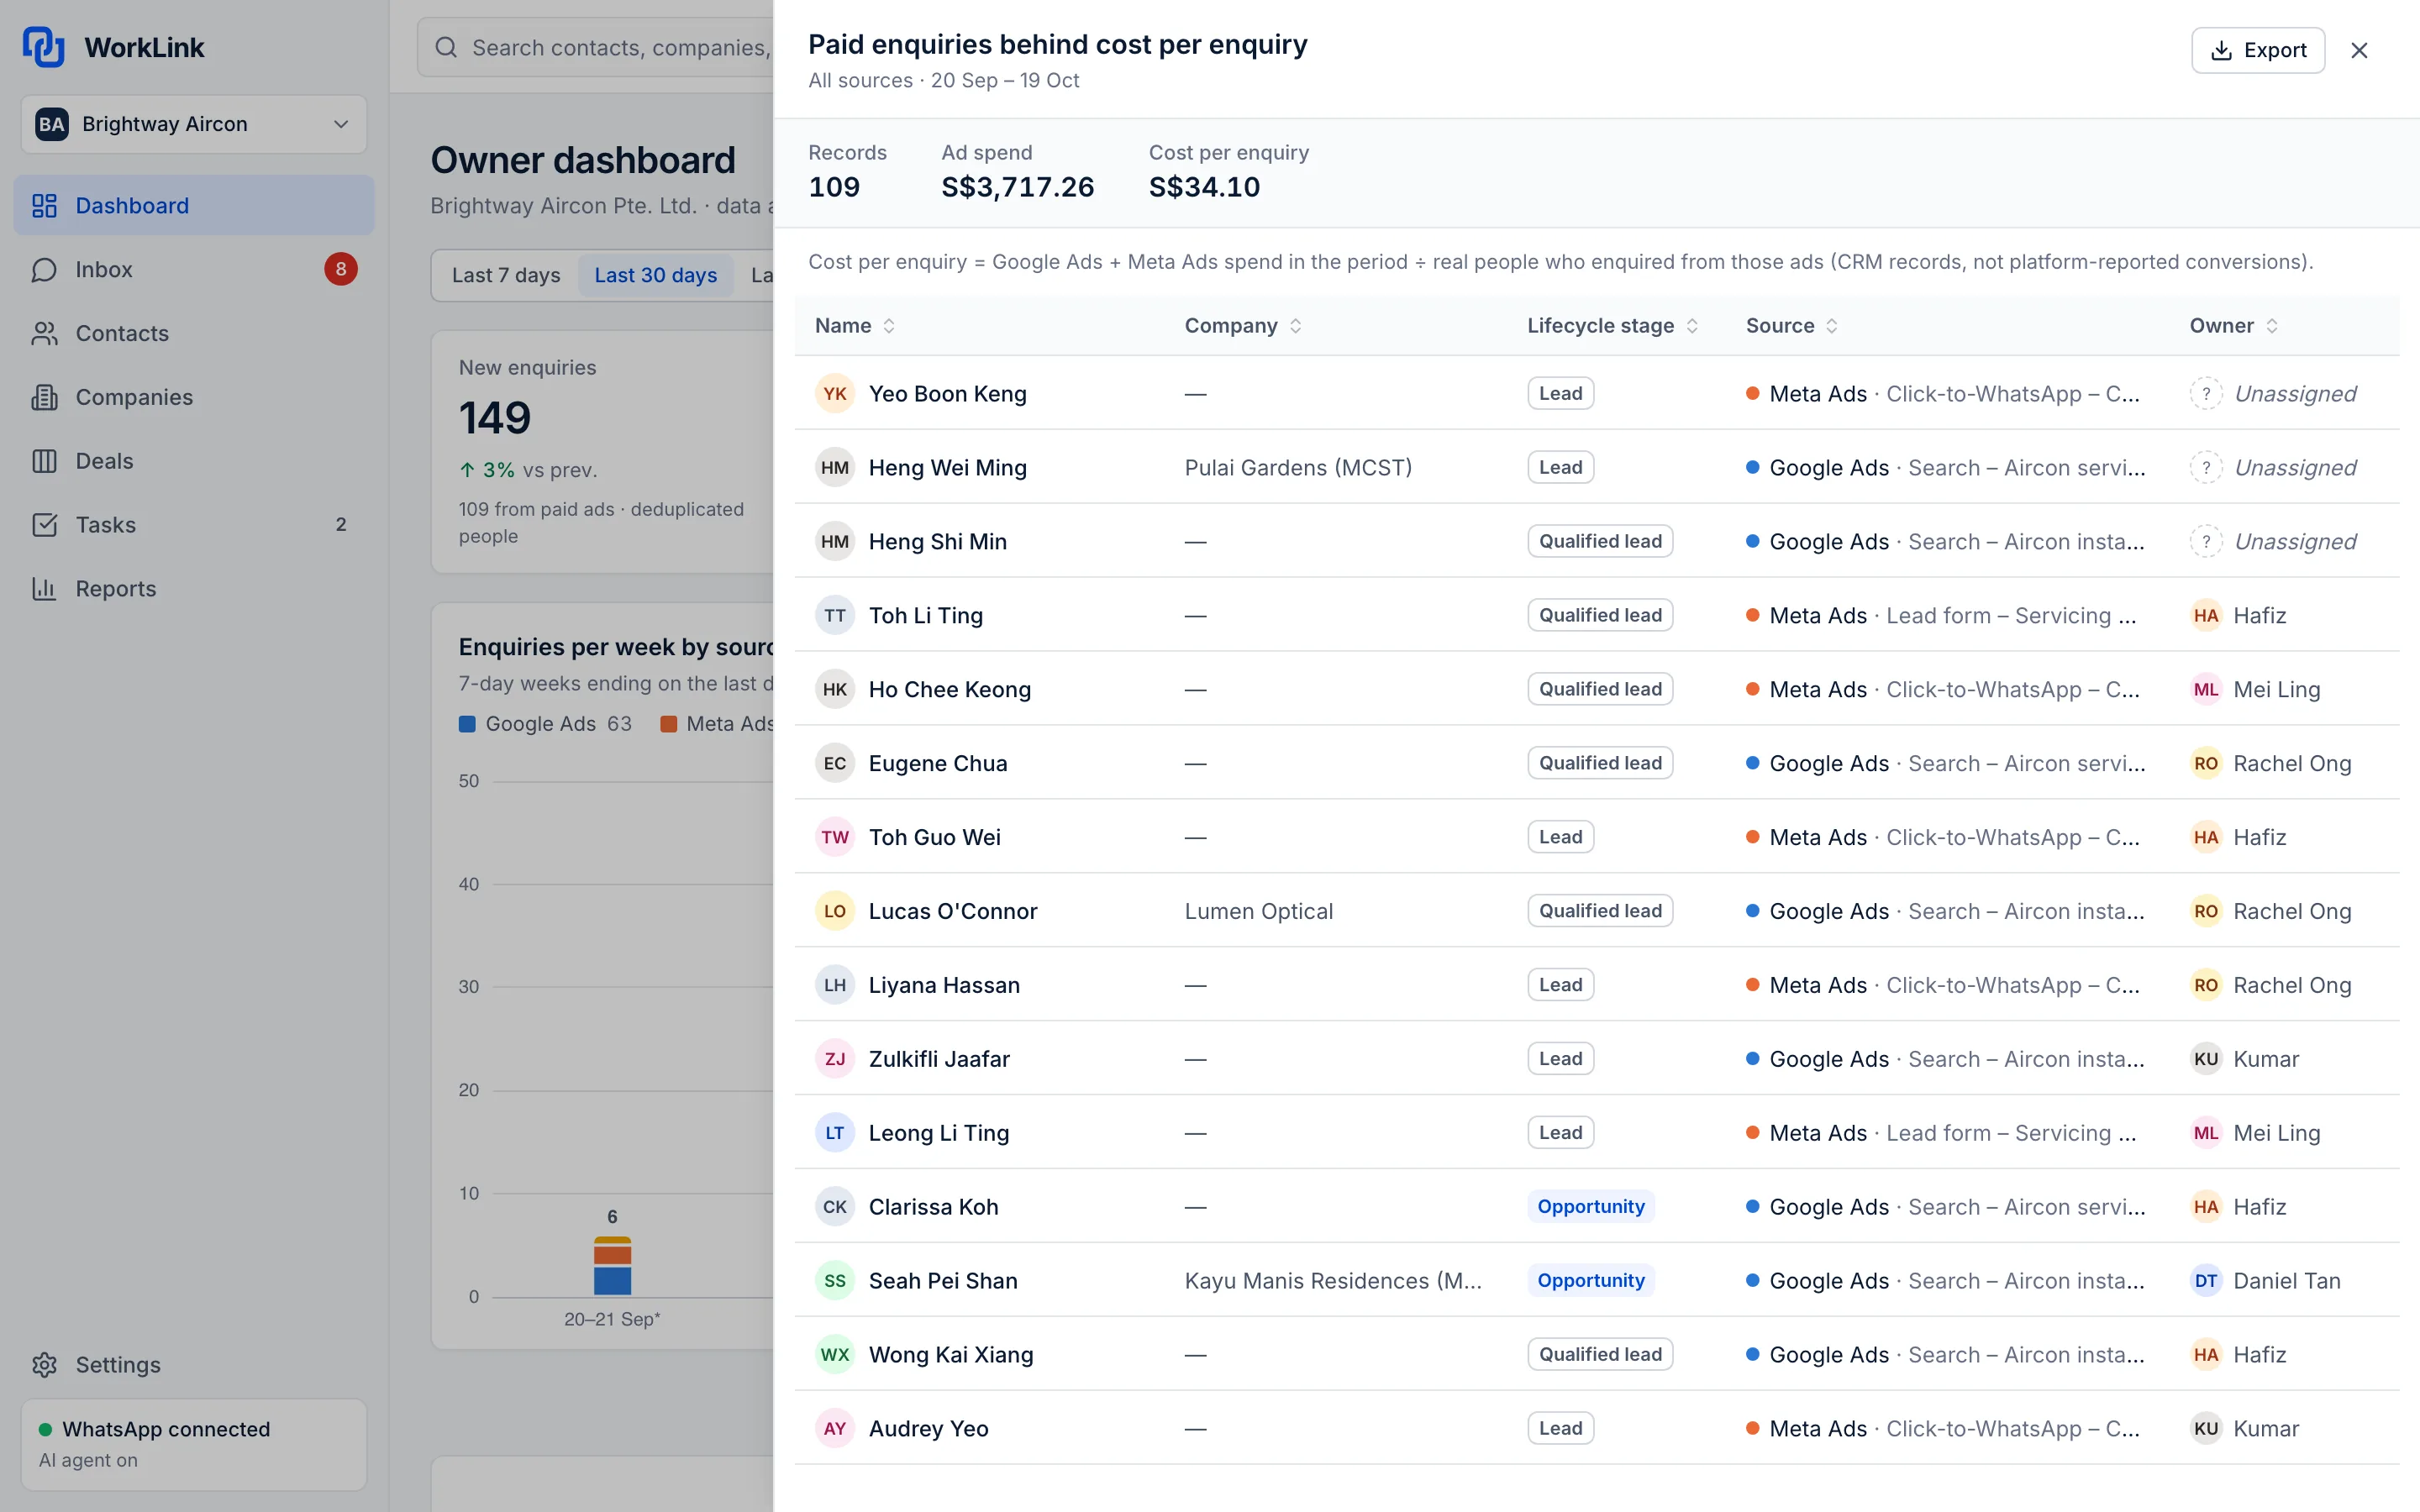
Click “real cost per enquiry” and a panel lists every paid enquiry behind it, with the source, campaign and owner of each. If a number looks wrong, you can see why.
- From any number to its records
- Definitions shown next to the figures
- No black-box totals
Ad attributionPro plan
Spend to revenue, campaign by campaign
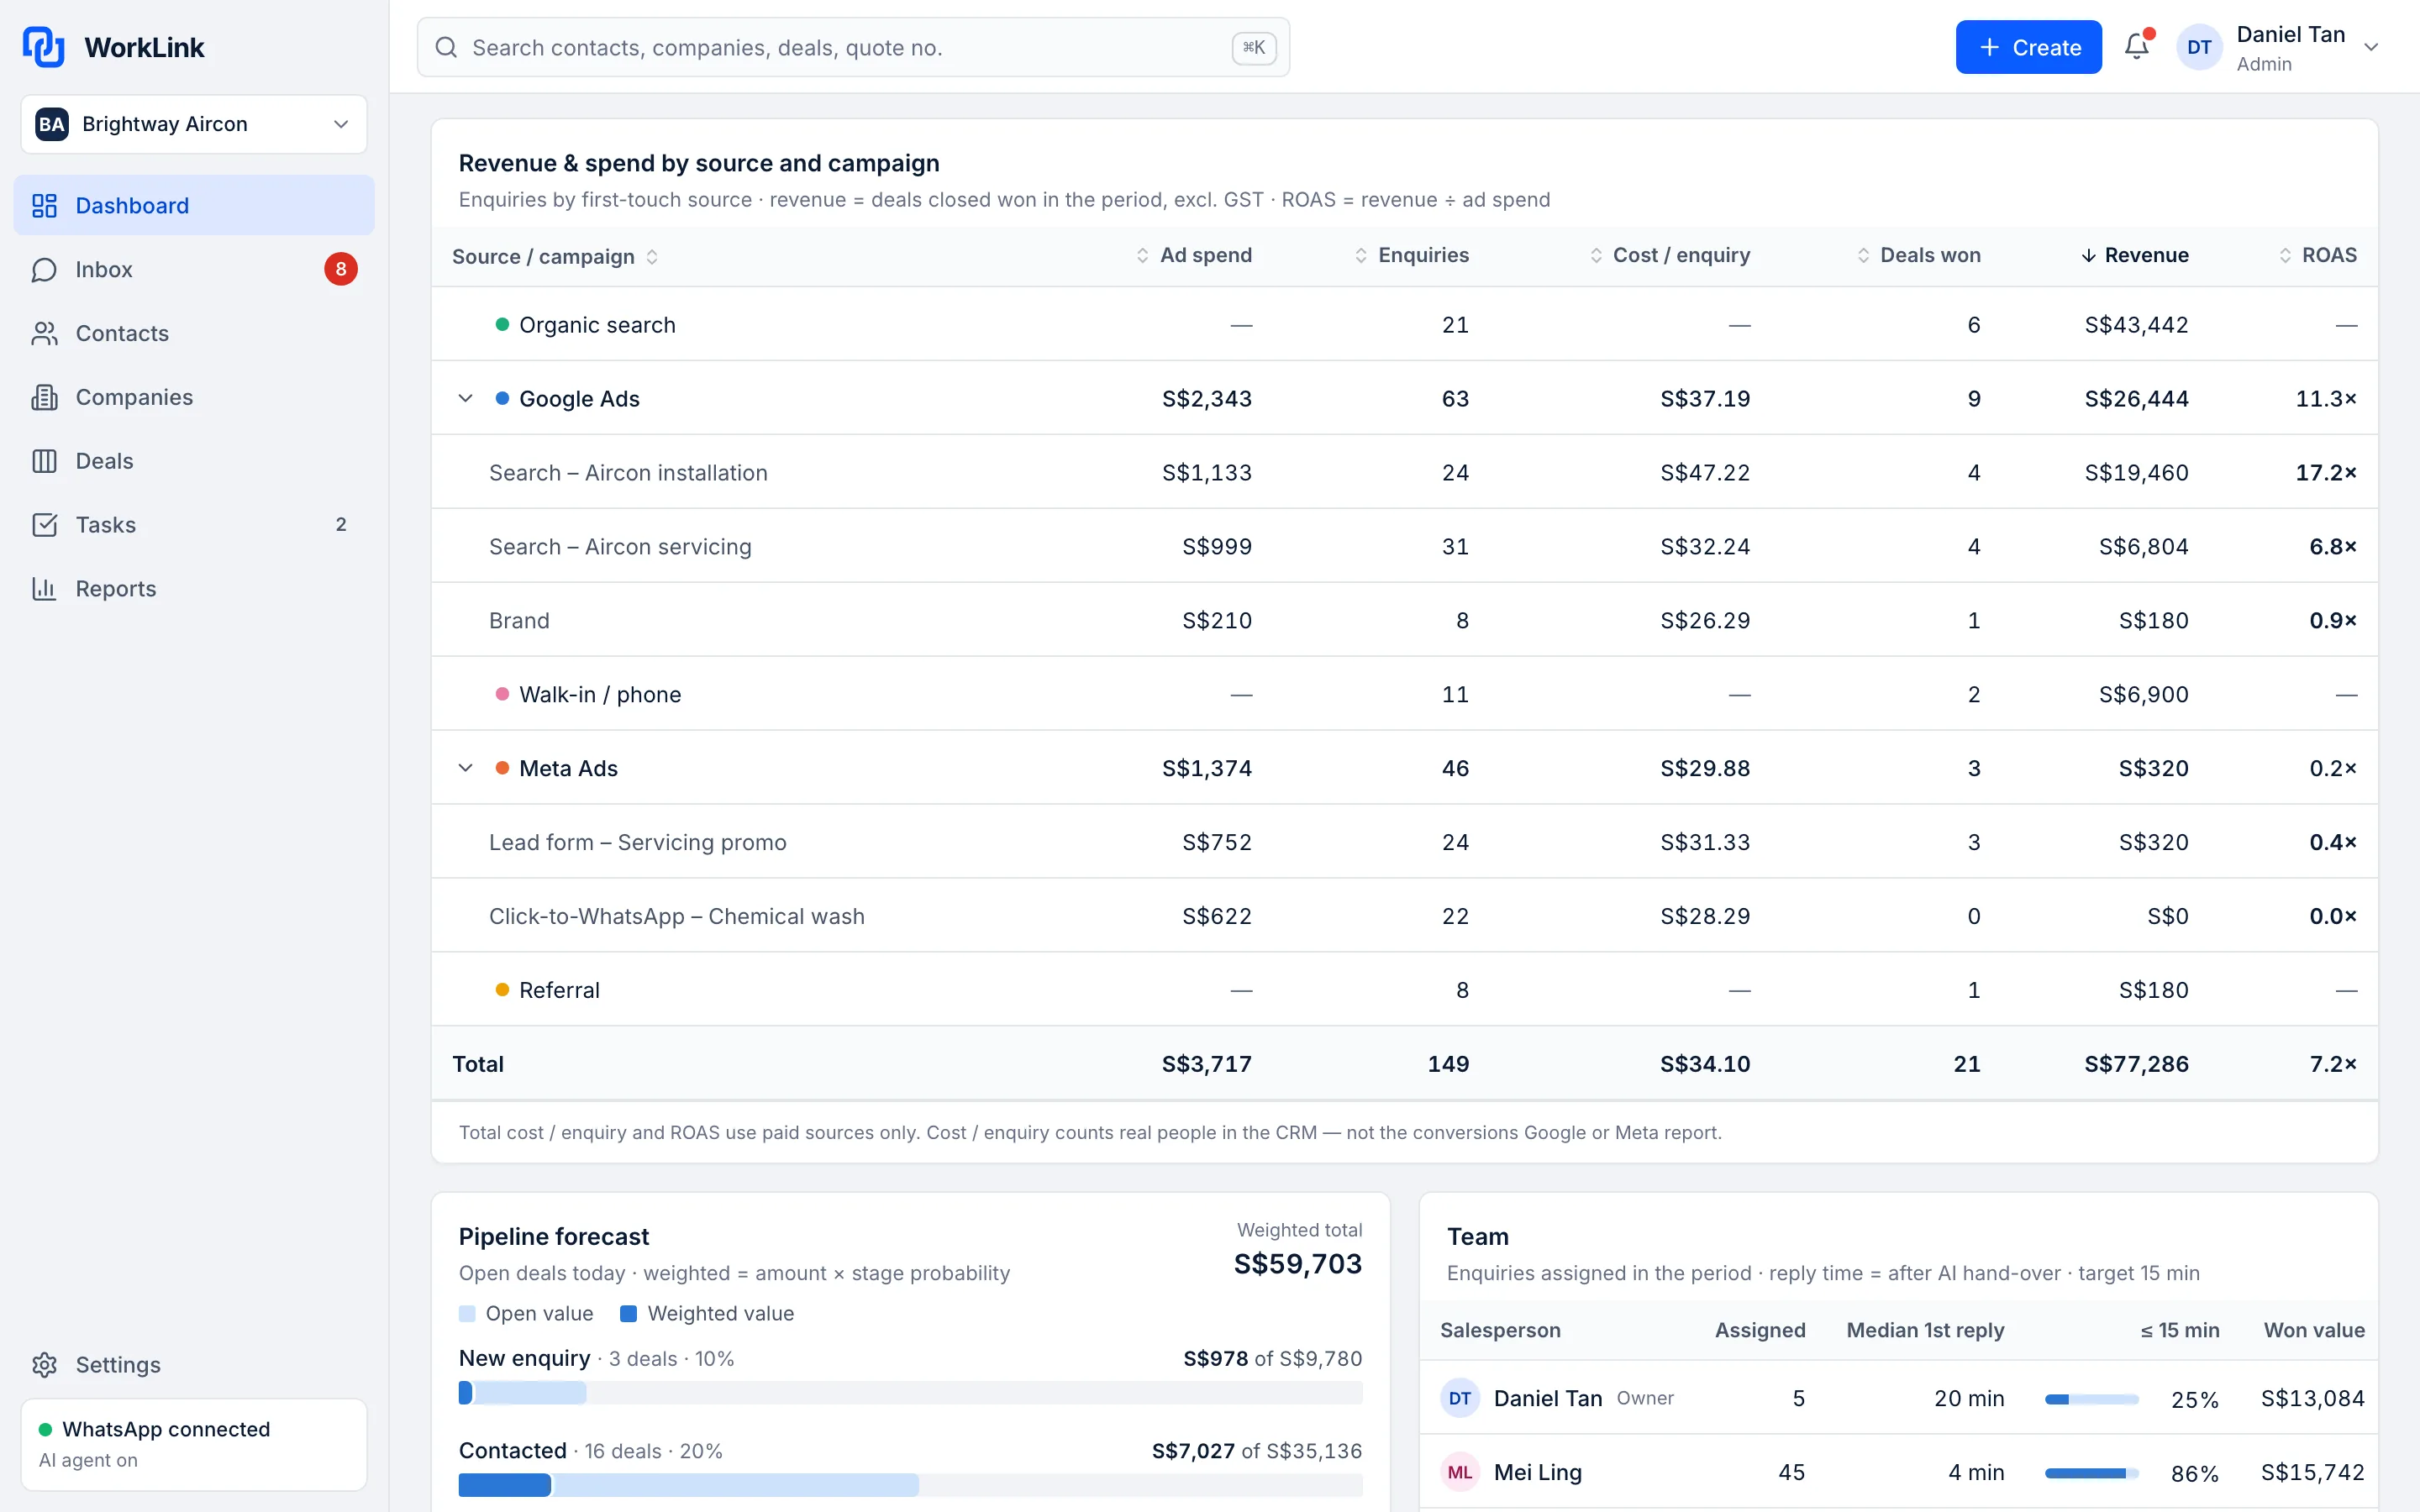
For Google Ads and Meta Ads, see spend, enquiries, cost per enquiry, deals won, revenue and return on ad spend for each campaign.
- Spend, enquiries and revenue in one table
- Return on ad spend by campaign
- Part of the Pro plan
Reports
Platform conversions next to real enquiries
The Source ROI report puts the conversions Google and Meta report next to the real enquiries in your CRM, so you can see when an ad platform is counting the wrong thing.
- Cost per enquiry and ROAS by campaign
- Clicks and platform-reported conversions alongside real enquiries
- Reply speed by salesperson
On your phone
The same numbers on a phone screen
Check the headline numbers between site visits, with the same filters as on a computer.
- Headline numbers stacked for a phone screen
- The same date-range and source filters
Demo dataAll screens show the WorkLink CRM prototype with a fictional company's data.
How the numbers are built
- 1Step 1
Ad spend
Spend by source and campaign from Google Ads and Meta Ads (Pro plan).
- 2Step 2
Enquiries
Real people who enquired, each linked to the source that brought them in.
- 3Step 3
Deals
Each enquiry followed through your pipeline to a won or lost deal.
- 4Step 4
Revenue
Money from won deals, by source and campaign. Click any number for its records.
Everything in the Owner Dashboard
Headline numbers
With comparison to the previous period.
Date and source filters
Last 7, 30 or 90 days, any source.
Enquiries by source
Weekly, by source.
Sales funnel
Step conversion and time in stage.
Drill-down
Every number opens its records.
Reply speed by salesperson
Median first reply per person.
Pipeline, team and enquiry-source dashboards
From the Growth plan.
Growth
Spend, cost per enquiry and ROAS by campaign
Meta and Google.
Pro
Custom reports
Build your own report.
Pro
The old way vs with WorkLink
Most small teams run sales on spreadsheets and replies from personal phones. Here is what changes.
The old way
Spreadsheets and personal phones
- Each ad platform reports its own “conversions” in its own app
- Revenue sits in a spreadsheet nobody updates
- Nobody can say which campaign produced last month's sales
- Reply speed is a guess
- A number looks wrong and there's no way to check it
With WorkLink
Owner Dashboard
- Ad spend, enquiries, deals and revenue on one screen
- Enquiries counted as real people, not clicks
- Revenue by source and campaign (Pro plan)
- Median first reply by salesperson
- Every number opens the records behind it
Which plan includes the Owner Dashboard
The Owner Dashboard grows with your plan, at a flat price per company. Prices in SGD.
Starter
Not includedS$49 / month per company
or S$490 a year · Up to 3 users
Pipeline dashboard only
Growth
IncludedS$149 / month per company
or S$1,490 a year · Up to 10 users
Pipeline, team and enquiry-source dashboards
Pro
IncludedS$299 / month per company
or S$2,990 a year · Unlimited users
Adds ad spend, cost per enquiry and ROAS by campaign (Meta and Google), and custom reports
Questions about the Owner Dashboard
Where do the ad spend numbers come from?
From your Google Ads and Meta Ads accounts. Spend, cost per enquiry and return on ad spend by campaign are part of the Pro plan.
What is “real cost per enquiry”?
Ad spend divided by the number of paid enquiries, where an enquiry is a real person who contacted you, counted once. It is not the platform's cost per click or cost per conversion.
Can I check how a number was worked out?
Yes. Every number on the dashboard opens the records behind it.
Which plan do I need?
Growth includes the pipeline, team and enquiry-source dashboards. Pro adds ad spend, cost per enquiry and ROAS by campaign for Meta and Google, and custom reports.
When can I start?
The product is in early access and we can't give a go-live date yet, because Meta onboarding for our WhatsApp integration is not complete. Join early access and we'll contact you when we can set you up. You can try the live demo today.
Try the Owner Dashboard in the live demo
Click around a fictional company's account, then join early access. We'll contact you when we can set you up. No go-live date is promised.